|
Download Data (XLS File) |
|
|||||
|
|||||
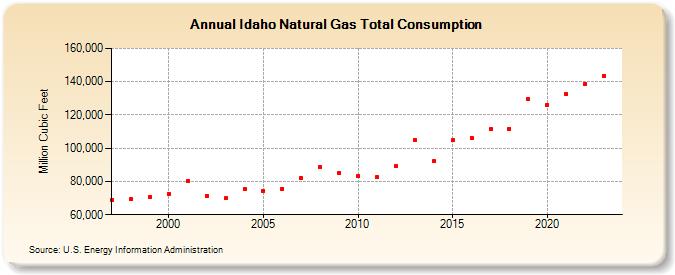
| Idaho Natural Gas Total Consumption (Million Cubic Feet) | |||||
| Decade | Year-0 | Year-1 | Year-2 | Year-3 | Year-4 | Year-5 | Year-6 | Year-7 | Year-8 | Year-9 |
|---|---|---|---|---|---|---|---|---|---|---|
| 1990's | 68,669 | 69,277 | 70,672 | |||||||
| 2000's | 72,697 | 80,279 | 71,481 | 69,868 | 75,335 | 74,540 | 75,709 | 81,937 | 88,515 | 85,197 |
| 2010's | 83,326 | 82,544 | 89,004 | 104,783 | 92,046 | 104,730 | 106,306 | 111,334 | 111,700 | 129,376 |
| 2020's | 126,207 | 132,656 | 139,855 |
| - = No Data Reported; -- = Not Applicable; NA = Not Available; W = Withheld to avoid disclosure of individual company data. |
| Release Date: 4/30/2024 |
| Next Release Date: 5/31/2024 |