|
Download Data (XLS File) |
|
|||||
|
|||||
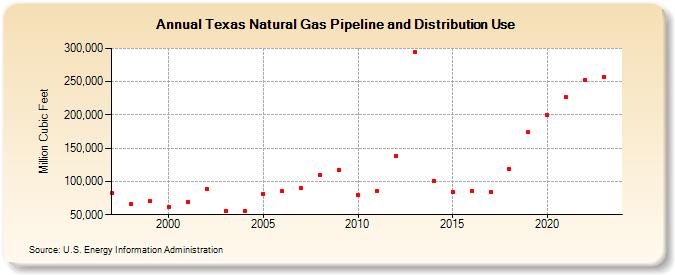
| Texas Natural Gas Pipeline and Distribution Use (Million Cubic Feet) | |||||
| Decade | Year-0 | Year-1 | Year-2 | Year-3 | Year-4 | Year-5 | Year-6 | Year-7 | Year-8 | Year-9 |
|---|---|---|---|---|---|---|---|---|---|---|
| 1990's | 82,115 | 65,800 | 70,397 | |||||||
| 2000's | 62,014 | 69,598 | 88,973 | 56,197 | 55,587 | 81,263 | 85,262 | 89,666 | 109,488 | 117,219 |
| 2010's | 79,817 | 85,549 | 138,429 | 294,316 | 101,296 | 84,874 | 85,527 | 84,470 | 117,964 | 173,753 |
| 2020's | 199,648 | 226,682 | 214,624 |
| - = No Data Reported; -- = Not Applicable; NA = Not Available; W = Withheld to avoid disclosure of individual company data. |
| Release Date: 3/29/2024 |
| Next Release Date: 4/30/2024 |