|
Download Data (XLS File) |
|
|||||
|
|||||
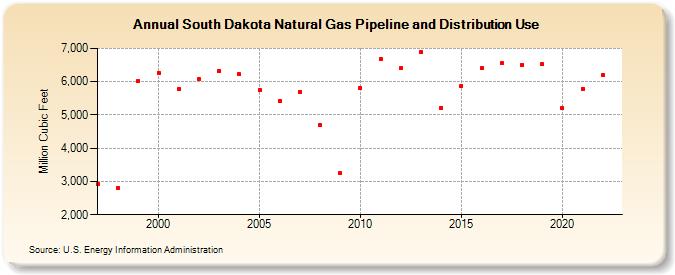
| South Dakota Natural Gas Pipeline and Distribution Use (Million Cubic Feet) | |||||
| Decade | Year-0 | Year-1 | Year-2 | Year-3 | Year-4 | Year-5 | Year-6 | Year-7 | Year-8 | Year-9 |
|---|---|---|---|---|---|---|---|---|---|---|
| 1990's | 2,910 | 2,805 | 6,020 | |||||||
| 2000's | 6,269 | 5,774 | 6,065 | 6,318 | 6,217 | 5,751 | 5,421 | 5,690 | 4,686 | 3,240 |
| 2010's | 5,806 | 6,692 | 6,402 | 6,888 | 5,221 | 5,872 | 6,405 | 6,551 | 6,515 | 6,528 |
| 2020's | 5,207 | 5,787 | 6,203 |
| - = No Data Reported; -- = Not Applicable; NA = Not Available; W = Withheld to avoid disclosure of individual company data. |
| Release Date: 3/29/2024 |
| Next Release Date: 4/30/2024 |