|
Download Data (XLS File) |
|
|||||
|
|||||
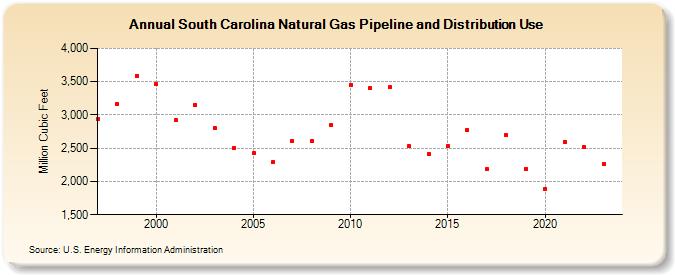
| South Carolina Natural Gas Pipeline and Distribution Use (Million Cubic Feet) | |||||
| Decade | Year-0 | Year-1 | Year-2 | Year-3 | Year-4 | Year-5 | Year-6 | Year-7 | Year-8 | Year-9 |
|---|---|---|---|---|---|---|---|---|---|---|
| 1990's | 2,940 | 3,163 | 3,589 | |||||||
| 2000's | 3,461 | 2,919 | 3,156 | 2,807 | 2,503 | 2,427 | 2,292 | 2,609 | 2,604 | 2,847 |
| 2010's | 3,452 | 3,408 | 3,416 | 2,529 | 2,409 | 2,534 | 2,774 | 2,185 | 2,697 | 2,194 |
| 2020's | 1,892 | 2,590 | 2,512 |
| - = No Data Reported; -- = Not Applicable; NA = Not Available; W = Withheld to avoid disclosure of individual company data. |
| Release Date: 3/29/2024 |
| Next Release Date: 4/30/2024 |