|
Download Data (XLS File) |
|
|||||
|
|||||
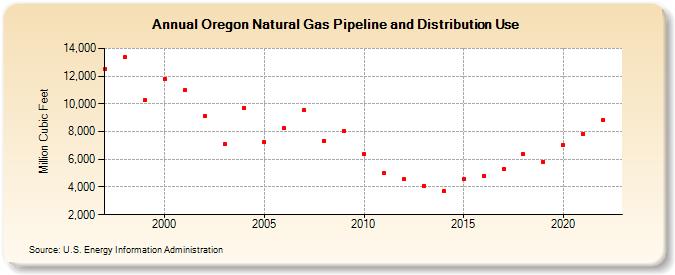
| Oregon Natural Gas Pipeline and Distribution Use (Million Cubic Feet) | |||||
| Decade | Year-0 | Year-1 | Year-2 | Year-3 | Year-4 | Year-5 | Year-6 | Year-7 | Year-8 | Year-9 |
|---|---|---|---|---|---|---|---|---|---|---|
| 1990's | 12,481 | 13,345 | 10,242 | |||||||
| 2000's | 11,775 | 10,990 | 9,117 | 7,098 | 9,707 | 7,264 | 8,238 | 9,532 | 7,354 | 8,073 |
| 2010's | 6,394 | 5,044 | 4,554 | 4,098 | 3,700 | 4,554 | 4,818 | 5,298 | 6,362 | 5,838 |
| 2020's | 7,026 | 7,859 | 8,819 |
| - = No Data Reported; -- = Not Applicable; NA = Not Available; W = Withheld to avoid disclosure of individual company data. |
| Release Date: 3/29/2024 |
| Next Release Date: 4/30/2024 |