|
Download Data (XLS File) |
|
|||||
|
|||||
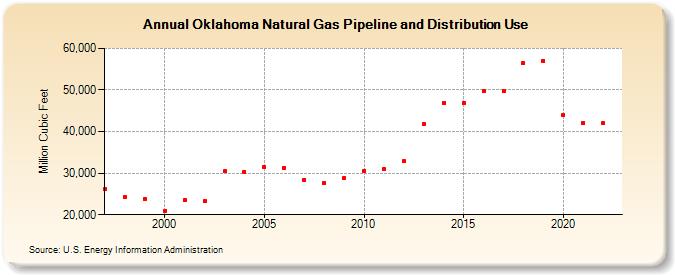
| Oklahoma Natural Gas Pipeline and Distribution Use (Million Cubic Feet) | |||||
| Decade | Year-0 | Year-1 | Year-2 | Year-3 | Year-4 | Year-5 | Year-6 | Year-7 | Year-8 | Year-9 |
|---|---|---|---|---|---|---|---|---|---|---|
| 1990's | 26,130 | 24,242 | 23,833 | |||||||
| 2000's | 21,001 | 23,537 | 23,340 | 30,396 | 30,370 | 31,444 | 31,333 | 28,463 | 27,581 | 28,876 |
| 2010's | 30,611 | 30,948 | 32,838 | 41,813 | 46,939 | 46,946 | 49,718 | 49,704 | 56,437 | 57,075 |
| 2020's | 43,880 | 42,105 | 42,038 |
| - = No Data Reported; -- = Not Applicable; NA = Not Available; W = Withheld to avoid disclosure of individual company data. |
| Release Date: 3/29/2024 |
| Next Release Date: 4/30/2024 |