|
Download Data (XLS File) |
|
|||||
|
|||||
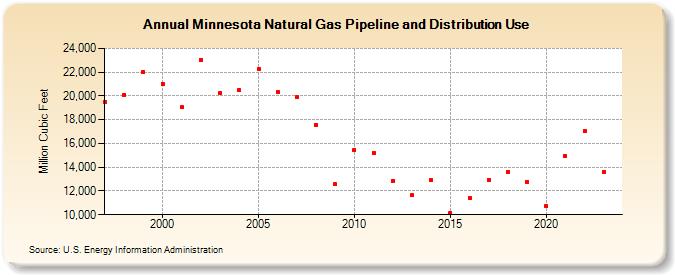
| Minnesota Natural Gas Pipeline and Distribution Use (Million Cubic Feet) | |||||
| Decade | Year-0 | Year-1 | Year-2 | Year-3 | Year-4 | Year-5 | Year-6 | Year-7 | Year-8 | Year-9 |
|---|---|---|---|---|---|---|---|---|---|---|
| 1990's | 19,509 | 20,095 | 22,019 | |||||||
| 2000's | 21,037 | 19,044 | 23,060 | 20,252 | 20,491 | 22,252 | 20,313 | 19,907 | 17,584 | 12,559 |
| 2010's | 15,465 | 15,223 | 12,842 | 11,626 | 12,921 | 10,157 | 11,409 | 12,926 | 13,617 | 12,776 |
| 2020's | 10,730 | 14,981 | 16,329 |
| - = No Data Reported; -- = Not Applicable; NA = Not Available; W = Withheld to avoid disclosure of individual company data. |
| Release Date: 3/29/2024 |
| Next Release Date: 4/30/2024 |