|
Download Data (XLS File) |
|
|||||
|
|||||
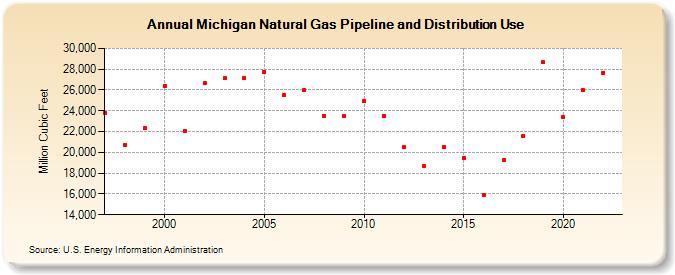
| Michigan Natural Gas Pipeline and Distribution Use (Million Cubic Feet) | |||||
| Decade | Year-0 | Year-1 | Year-2 | Year-3 | Year-4 | Year-5 | Year-6 | Year-7 | Year-8 | Year-9 |
|---|---|---|---|---|---|---|---|---|---|---|
| 1990's | 23,776 | 20,733 | 22,355 | |||||||
| 2000's | 26,359 | 22,036 | 26,685 | 27,129 | 27,198 | 27,742 | 25,532 | 25,961 | 23,518 | 23,468 |
| 2010's | 24,904 | 23,537 | 20,496 | 18,713 | 20,530 | 19,490 | 15,887 | 19,238 | 21,566 | 28,665 |
| 2020's | 23,396 | 25,958 | 27,678 |
| - = No Data Reported; -- = Not Applicable; NA = Not Available; W = Withheld to avoid disclosure of individual company data. |
| Release Date: 3/29/2024 |
| Next Release Date: 4/30/2024 |