|
Download Data (XLS File) |
|
|||||
|
|||||
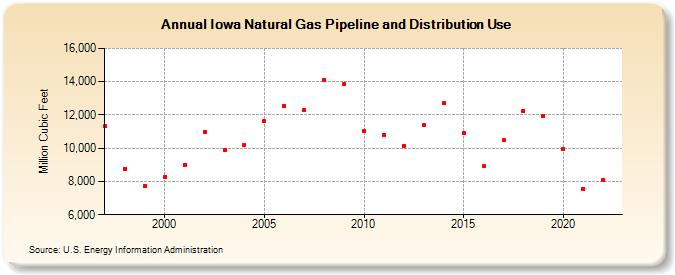
| Iowa Natural Gas Pipeline and Distribution Use (Million Cubic Feet) | |||||
| Decade | Year-0 | Year-1 | Year-2 | Year-3 | Year-4 | Year-5 | Year-6 | Year-7 | Year-8 | Year-9 |
|---|---|---|---|---|---|---|---|---|---|---|
| 1990's | 11,309 | 8,770 | 7,748 | |||||||
| 2000's | 8,266 | 8,988 | 10,975 | 9,898 | 10,194 | 11,622 | 12,525 | 12,320 | 14,101 | 13,846 |
| 2010's | 11,042 | 10,811 | 10,145 | 11,398 | 12,708 | 10,923 | 8,899 | 10,463 | 12,227 | 11,929 |
| 2020's | 9,974 | 7,554 | 8,079 |
| - = No Data Reported; -- = Not Applicable; NA = Not Available; W = Withheld to avoid disclosure of individual company data. |
| Release Date: 8/30/2024 |
| Next Release Date: 9/30/2024 |