|
Download Data (XLS File) |
|
|||||
|
|||||
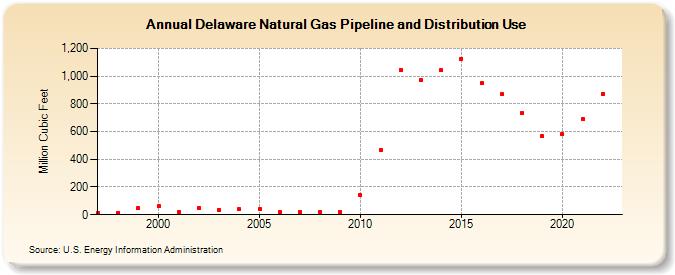
| Delaware Natural Gas Pipeline and Distribution Use (Million Cubic Feet) | |||||
| Decade | Year-0 | Year-1 | Year-2 | Year-3 | Year-4 | Year-5 | Year-6 | Year-7 | Year-8 | Year-9 |
|---|---|---|---|---|---|---|---|---|---|---|
| 1990's | 13 | 15 | 45 | |||||||
| 2000's | 62 | 23 | 49 | 34 | 39 | 40 | 18 | 16 | 18 | 22 |
| 2010's | 140 | 464 | 1,045 | 970 | 1,042 | 1,126 | 949 | 868 | 735 | 565 |
| 2020's | 579 | 689 | 871 |
| - = No Data Reported; -- = Not Applicable; NA = Not Available; W = Withheld to avoid disclosure of individual company data. |
| Release Date: 3/29/2024 |
| Next Release Date: 4/30/2024 |