|
Download Data (XLS File) |
|
|||||
|
|||||
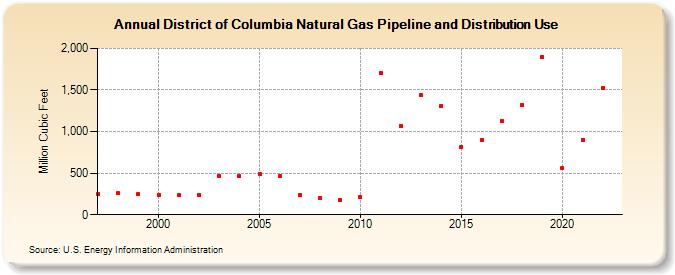
| District of Columbia Natural Gas Pipeline and Distribution Use (Million Cubic Feet) | |||||
| Decade | Year-0 | Year-1 | Year-2 | Year-3 | Year-4 | Year-5 | Year-6 | Year-7 | Year-8 | Year-9 |
|---|---|---|---|---|---|---|---|---|---|---|
| 1990's | 246 | 256 | 244 | |||||||
| 2000's | 243 | 236 | 242 | 470 | 466 | 487 | 464 | 238 | 203 | 177 |
| 2010's | 213 | 1,703 | 1,068 | 1,434 | 1,305 | 817 | 901 | 1,126 | 1,317 | 1,898 |
| 2020's | 561 | 902 | 1,518 |
| - = No Data Reported; -- = Not Applicable; NA = Not Available; W = Withheld to avoid disclosure of individual company data. |
| Release Date: 3/29/2024 |
| Next Release Date: 4/30/2024 |