|
Download Data (XLS File) |
|
|||||
|
|||||
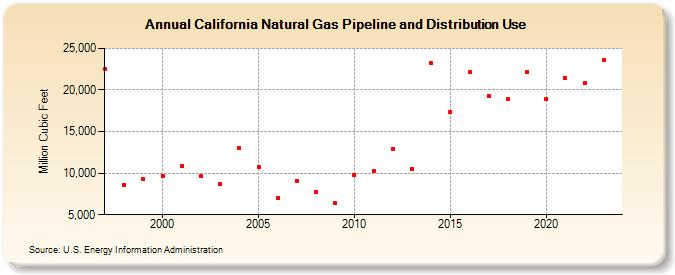
| California Natural Gas Pipeline and Distribution Use (Million Cubic Feet) | |||||
| Decade | Year-0 | Year-1 | Year-2 | Year-3 | Year-4 | Year-5 | Year-6 | Year-7 | Year-8 | Year-9 |
|---|---|---|---|---|---|---|---|---|---|---|
| 1990's | 22,493 | 8,587 | 9,341 | |||||||
| 2000's | 9,698 | 10,913 | 9,610 | 8,670 | 12,969 | 10,775 | 7,023 | 8,994 | 7,744 | 6,386 |
| 2010's | 9,741 | 10,276 | 12,906 | 10,471 | 23,208 | 17,295 | 22,112 | 19,280 | 18,866 | 22,171 |
| 2020's | 18,936 | 21,449 | 20,709 |
| - = No Data Reported; -- = Not Applicable; NA = Not Available; W = Withheld to avoid disclosure of individual company data. |
| Release Date: 3/29/2024 |
| Next Release Date: 4/30/2024 |