|
Download Data (XLS File) |
|
|||||
|
|||||
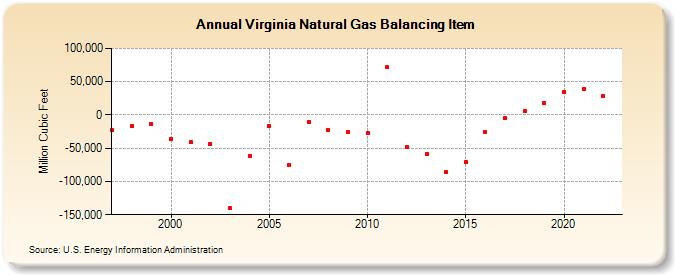
| Virginia Natural Gas Balancing Item (Million Cubic Feet) | |||||
| Decade | Year-0 | Year-1 | Year-2 | Year-3 | Year-4 | Year-5 | Year-6 | Year-7 | Year-8 | Year-9 |
|---|---|---|---|---|---|---|---|---|---|---|
| 1990's | -22,758 | -15,997 | -13,773 | |||||||
| 2000's | -36,173 | -41,439 | -43,072 | -140,560 | -61,300 | -17,024 | -75,652 | -10,746 | -22,061 | -26,170 |
| 2010's | -26,907 | 71,428 | -48,394 | -58,916 | -86,004 | -70,486 | -25,195 | -4,890 | 5,370 | 17,696 |
| 2020's | 34,600 | 38,650 | 28,394 |
| - = No Data Reported; -- = Not Applicable; NA = Not Available; W = Withheld to avoid disclosure of individual company data. |
| Release Date: 3/29/2024 |
| Next Release Date: 4/30/2024 |