|
Download Data (XLS File) |
|
|||||
|
|||||
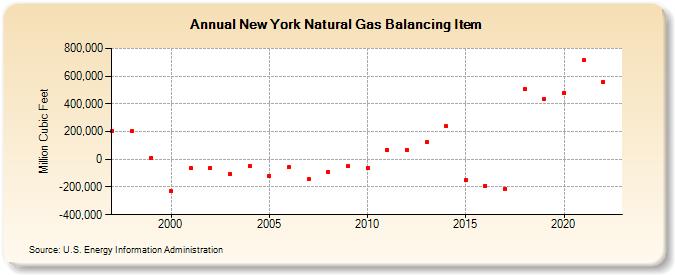
| New York Natural Gas Balancing Item (Million Cubic Feet) | |||||
| Decade | Year-0 | Year-1 | Year-2 | Year-3 | Year-4 | Year-5 | Year-6 | Year-7 | Year-8 | Year-9 |
|---|---|---|---|---|---|---|---|---|---|---|
| 1990's | 201,246 | 204,128 | 11,699 | |||||||
| 2000's | -232,407 | -65,420 | -60,838 | -107,489 | -49,095 | -117,265 | -57,852 | -145,642 | -90,675 | -51,097 |
| 2010's | -61,456 | 66,046 | 69,848 | 121,046 | 237,579 | -149,343 | -190,616 | -212,140 | 503,468 | 433,091 |
| 2020's | 480,610 | 712,893 | 560,649 |
| - = No Data Reported; -- = Not Applicable; NA = Not Available; W = Withheld to avoid disclosure of individual company data. |
| Release Date: 3/29/2024 |
| Next Release Date: 4/30/2024 |