|
Download Data (XLS File) |
|
|||||
|
|||||
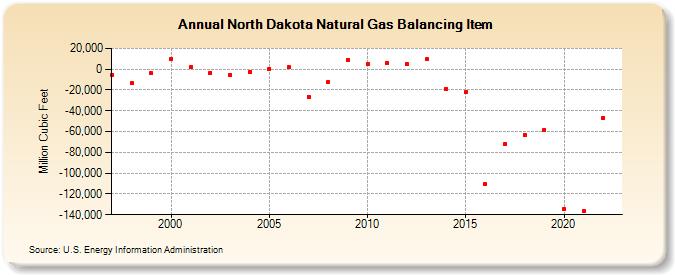
| North Dakota Natural Gas Balancing Item (Million Cubic Feet) | |||||
| Decade | Year-0 | Year-1 | Year-2 | Year-3 | Year-4 | Year-5 | Year-6 | Year-7 | Year-8 | Year-9 |
|---|---|---|---|---|---|---|---|---|---|---|
| 1990's | -5,428 | -13,344 | -4,038 | |||||||
| 2000's | 9,598 | 2,155 | -3,272 | -5,214 | -2,542 | 267 | 1,632 | -26,521 | -12,197 | 8,996 |
| 2010's | 4,620 | 6,136 | 5,087 | 9,498 | -18,820 | -21,828 | -110,861 | -71,749 | -63,459 | -58,379 |
| 2020's | -134,715 | -136,694 | -46,611 |
| - = No Data Reported; -- = Not Applicable; NA = Not Available; W = Withheld to avoid disclosure of individual company data. |
| Release Date: 3/29/2024 |
| Next Release Date: 4/30/2024 |