|
Download Data (XLS File) |
|
|||||
|
|||||
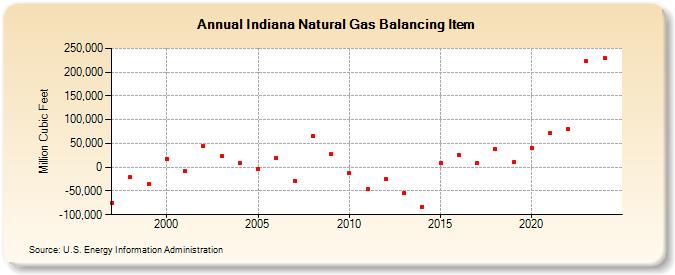
| Indiana Natural Gas Balancing Item (Million Cubic Feet) | |||||
| Decade | Year-0 | Year-1 | Year-2 | Year-3 | Year-4 | Year-5 | Year-6 | Year-7 | Year-8 | Year-9 |
|---|---|---|---|---|---|---|---|---|---|---|
| 1990's | -74,990 | -21,364 | -35,752 | |||||||
| 2000's | 18,147 | -7,654 | 44,294 | 23,325 | 8,526 | -3,988 | 19,140 | -28,924 | 64,839 | 26,717 |
| 2010's | -12,536 | -46,137 | -24,623 | -54,488 | -83,388 | 9,020 | 26,373 | 8,953 | 38,228 | 10,898 |
| 2020's | 40,943 | 71,422 | 83,071 |
| - = No Data Reported; -- = Not Applicable; NA = Not Available; W = Withheld to avoid disclosure of individual company data. |
| Release Date: 8/30/2024 |
| Next Release Date: 9/30/2024 |