|
Download Data (XLS File) |
|
|||||
|
|||||
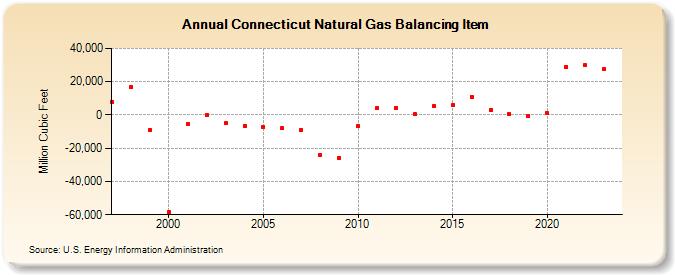
| Connecticut Natural Gas Balancing Item (Million Cubic Feet) | |||||
| Decade | Year-0 | Year-1 | Year-2 | Year-3 | Year-4 | Year-5 | Year-6 | Year-7 | Year-8 | Year-9 |
|---|---|---|---|---|---|---|---|---|---|---|
| 1990's | 7,856 | 16,693 | -8,865 | |||||||
| 2000's | -58,546 | -5,648 | -140 | -4,902 | -6,647 | -7,120 | -8,141 | -8,972 | -24,011 | -25,959 |
| 2010's | -6,645 | 3,976 | 4,246 | 374 | 5,347 | 5,762 | 11,016 | 2,967 | 457 | -877 |
| 2020's | 862 | 29,055 | 28,740 |
| - = No Data Reported; -- = Not Applicable; NA = Not Available; W = Withheld to avoid disclosure of individual company data. |
| Release Date: 3/29/2024 |
| Next Release Date: 4/30/2024 |