|
Download Data (XLS File) |
|
|||||
|
|||||
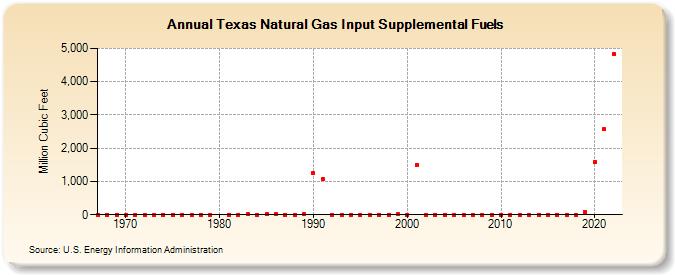
| Texas Natural Gas Input Supplemental Fuels (Million Cubic Feet) | |||||
| Decade | Year-0 | Year-1 | Year-2 | Year-3 | Year-4 | Year-5 | Year-6 | Year-7 | Year-8 | Year-9 |
|---|---|---|---|---|---|---|---|---|---|---|
| 1960's | 0 | 0 | 0 | |||||||
| 1970's | 0 | 0 | 0 | 0 | 0 | 0 | 0 | 0 | 0 | 0 |
| 1980's | 0 | 1 | 14 | 2 | 9 | 19 | 4 | 4 | 9 | |
| 1990's | 1,240 | 1,076 | 1 | 3 | 1 | 1 | 0 | 0 | 0 | 17 |
| 2000's | 0 | 1,505 | 2 | 0 | 0 | 0 | 0 | 0 | 0 | 0 |
| 2010's | 0 | 0 | 0 | 0 | 0 | 0 | 0 | 0 | 0 | 81 |
| 2020's | 1,598 | 2,569 | 4,844 |
| - = No Data Reported; -- = Not Applicable; NA = Not Available; W = Withheld to avoid disclosure of individual company data. |
| Release Date: 4/30/2024 |
| Next Release Date: 5/31/2024 |