|
Download Data (XLS File) |
|
|||||
|
|||||
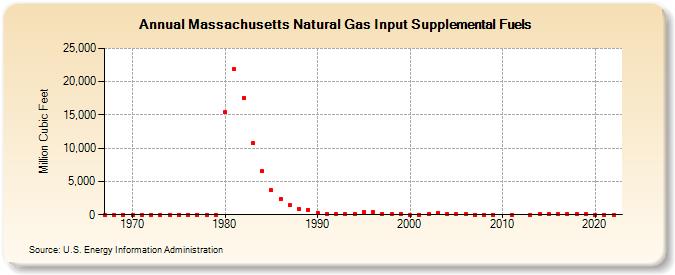
| Massachusetts Natural Gas Input Supplemental Fuels (Million Cubic Feet) | |||||
| Decade | Year-0 | Year-1 | Year-2 | Year-3 | Year-4 | Year-5 | Year-6 | Year-7 | Year-8 | Year-9 |
|---|---|---|---|---|---|---|---|---|---|---|
| 1960's | 0 | 0 | 0 | |||||||
| 1970's | 0 | 0 | 0 | 0 | 0 | 0 | 0 | 0 | 0 | 0 |
| 1980's | 15,366 | 21,828 | 17,586 | 10,732 | 6,545 | 3,668 | 2,379 | 1,404 | 876 | 692 |
| 1990's | 317 | 120 | 105 | 61 | 154 | 420 | 426 | 147 | 68 | 134 |
| 2000's | 26 | 16 | 137 | 324 | 80 | 46 | 51 | 15 | 13 | 10 |
| 2010's | 0 | 3 | 108 | 90 | 57 | 55 | 77 | 35 | ||
| 2020's | 10 | 15 | 18 |
| - = No Data Reported; -- = Not Applicable; NA = Not Available; W = Withheld to avoid disclosure of individual company data. |
| Release Date: 3/29/2024 |
| Next Release Date: 4/30/2024 |