|
Download Data (XLS File) |
|
|||||
|
|||||
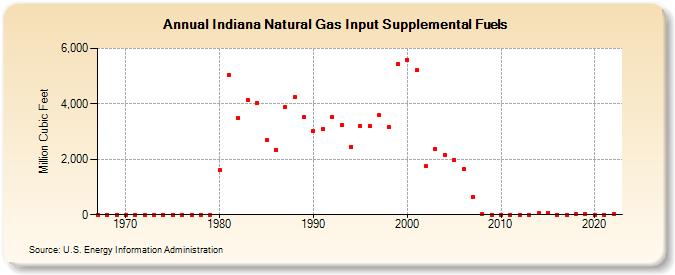
| Indiana Natural Gas Input Supplemental Fuels (Million Cubic Feet) | |||||
| Decade | Year-0 | Year-1 | Year-2 | Year-3 | Year-4 | Year-5 | Year-6 | Year-7 | Year-8 | Year-9 |
|---|---|---|---|---|---|---|---|---|---|---|
| 1960's | 0 | 0 | 0 | |||||||
| 1970's | 0 | 0 | 0 | 0 | 0 | 0 | 0 | 0 | 0 | 0 |
| 1980's | 1,602 | 5,056 | 3,496 | 4,142 | 4,027 | 2,711 | 2,351 | 3,890 | 4,243 | 3,512 |
| 1990's | 3,015 | 3,077 | 3,507 | 3,232 | 2,457 | 3,199 | 3,194 | 3,580 | 3,149 | 5,442 |
| 2000's | 5,583 | 5,219 | 1,748 | 2,376 | 2,164 | 1,988 | 1,642 | 635 | 30 | 1 |
| 2010's | 1 | 5 | 1 | 6 | 69 | 78 | 1 | 2 | 33 | 29 |
| 2020's | 2 | 1 | 34 |
| - = No Data Reported; -- = Not Applicable; NA = Not Available; W = Withheld to avoid disclosure of individual company data. |
| Release Date: 4/30/2024 |
| Next Release Date: 5/31/2024 |