|
Download Data (XLS File) |
|
|||||
|
|||||
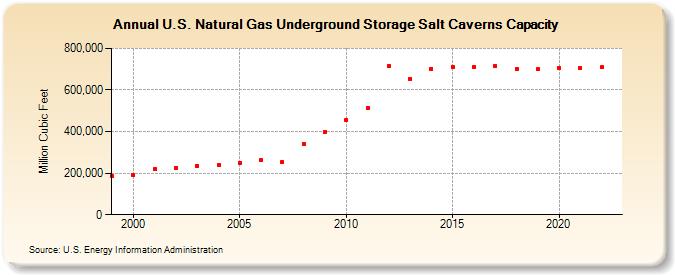
| U.S. Natural Gas Underground Storage Salt Caverns Capacity (Million Cubic Feet) | |||||
| Decade | Year-0 | Year-1 | Year-2 | Year-3 | Year-4 | Year-5 | Year-6 | Year-7 | Year-8 | Year-9 |
|---|---|---|---|---|---|---|---|---|---|---|
| 1990's | 185,451 | |||||||||
| 2000's | 189,043 | 218,483 | 225,958 | 234,601 | 239,990 | 250,532 | 261,988 | 253,410 | 341,213 | 397,560 |
| 2010's | 456,009 | 512,279 | 715,821 | 654,266 | 702,548 | 709,380 | 712,519 | 715,847 | 701,690 | 698,505 |
| 2020's | 705,547 | 704,906 | 708,117 |
| - = No Data Reported; -- = Not Applicable; NA = Not Available; W = Withheld to avoid disclosure of individual company data. |
| Release Date: 3/29/2024 |
| Next Release Date: 4/30/2024 |