|
Download Data (XLS File) |
|
|||||
|
|||||
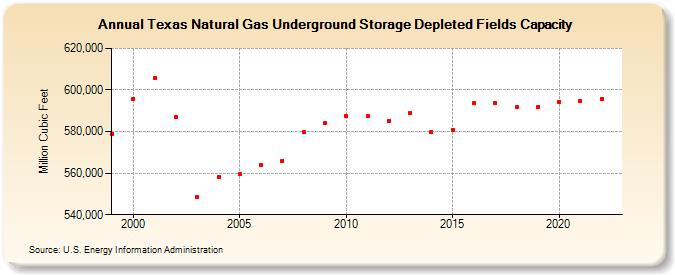
| Texas Natural Gas Underground Storage Depleted Fields Capacity (Million Cubic Feet) | |||||
| Decade | Year-0 | Year-1 | Year-2 | Year-3 | Year-4 | Year-5 | Year-6 | Year-7 | Year-8 | Year-9 |
|---|---|---|---|---|---|---|---|---|---|---|
| 1990's | 579,040 | |||||||||
| 2000's | 595,750 | 605,750 | 587,131 | 548,444 | 558,079 | 559,637 | 564,035 | 565,992 | 579,691 | 584,042 |
| 2010's | 587,439 | 587,439 | 584,881 | 588,852 | 579,988 | 580,870 | 593,685 | 593,685 | 591,820 | 591,820 |
| 2020's | 594,379 | 594,664 | 595,804 |
| - = No Data Reported; -- = Not Applicable; NA = Not Available; W = Withheld to avoid disclosure of individual company data. |
| Release Date: 3/29/2024 |
| Next Release Date: 4/30/2024 |