|
Download Data (XLS File) |
|
|||||
|
|||||
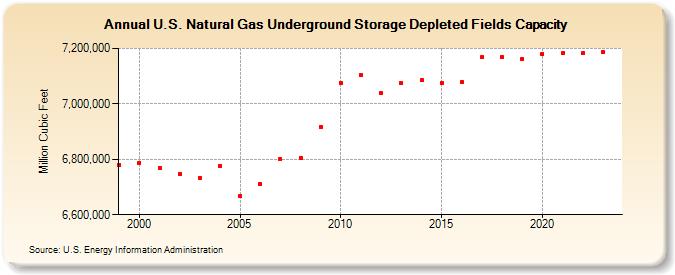
| U.S. Natural Gas Underground Storage Depleted Fields Capacity (Million Cubic Feet) | |||||
| Decade | Year-0 | Year-1 | Year-2 | Year-3 | Year-4 | Year-5 | Year-6 | Year-7 | Year-8 | Year-9 |
|---|---|---|---|---|---|---|---|---|---|---|
| 1990's | 6,780,700 | |||||||||
| 2000's | 6,788,130 | 6,768,622 | 6,747,108 | 6,733,983 | 6,776,894 | 6,667,222 | 6,711,656 | 6,801,291 | 6,805,490 | 6,917,547 |
| 2010's | 7,074,773 | 7,104,948 | 7,038,245 | 7,074,916 | 7,085,773 | 7,075,821 | 7,079,874 | 7,167,450 | 7,169,314 | 7,161,892 |
| 2020's | 7,181,030 | 7,183,176 | 7,187,601 |
| - = No Data Reported; -- = Not Applicable; NA = Not Available; W = Withheld to avoid disclosure of individual company data. |
| Release Date: 3/29/2024 |
| Next Release Date: 4/30/2024 |