|
Download Data (XLS File) |
|
|||||
|
|||||
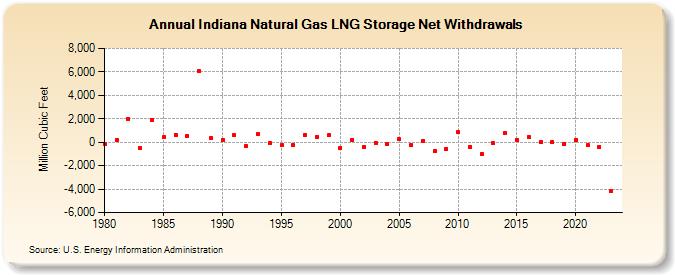
| Indiana Natural Gas LNG Storage Net Withdrawals (Million Cubic Feet) | |||||
| Decade | Year-0 | Year-1 | Year-2 | Year-3 | Year-4 | Year-5 | Year-6 | Year-7 | Year-8 | Year-9 |
|---|---|---|---|---|---|---|---|---|---|---|
| 1980's | -129 | 204 | 1,991 | -498 | 1,878 | 429 | 615 | 541 | 6,077 | 344 |
| 1990's | 230 | 595 | -339 | 738 | -95 | -239 | -234 | 653 | 486 | 582 |
| 2000's | -480 | 223 | -376 | -28 | -187 | 236 | -275 | 86 | -766 | -590 |
| 2010's | 835 | -380 | -977 | -81 | 771 | 205 | 463 | 15 | -4 | -159 |
| 2020's | 146 | -252 | -398 |
| - = No Data Reported; -- = Not Applicable; NA = Not Available; W = Withheld to avoid disclosure of individual company data. |
| Release Date: 4/30/2024 |
| Next Release Date: 5/31/2024 |