|
Download Data (XLS File) |
|
|||||
|
|||||
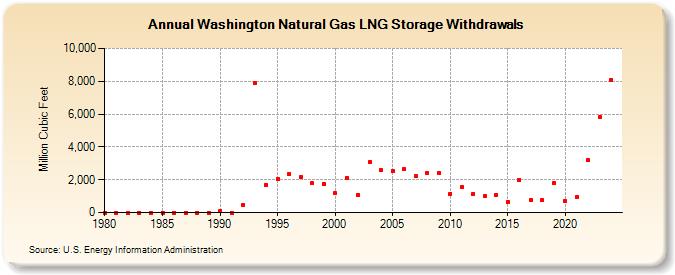
| Washington Natural Gas LNG Storage Withdrawals (Million Cubic Feet) | |||||
| Decade | Year-0 | Year-1 | Year-2 | Year-3 | Year-4 | Year-5 | Year-6 | Year-7 | Year-8 | Year-9 |
|---|---|---|---|---|---|---|---|---|---|---|
| 1980's | 0 | 0 | 0 | 0 | 0 | 0 | 0 | 0 | 0 | 0 |
| 1990's | 104 | 0 | 471 | 7,886 | 1,701 | 2,055 | 2,356 | 2,145 | 1,779 | 1,741 |
| 2000's | 1,178 | 2,126 | 1,076 | 3,071 | 2,565 | 2,536 | 2,663 | 2,211 | 2,417 | 2,405 |
| 2010's | 1,157 | 1,564 | 1,138 | 981 | 1,094 | 668 | 2,005 | 781 | 753 | 1,803 |
| 2020's | 704 | 931 | 3,174 |
| - = No Data Reported; -- = Not Applicable; NA = Not Available; W = Withheld to avoid disclosure of individual company data. |
| Release Date: 8/30/2024 |
| Next Release Date: 9/30/2024 |