|
Download Data (XLS File) |
|
|||||
|
|||||
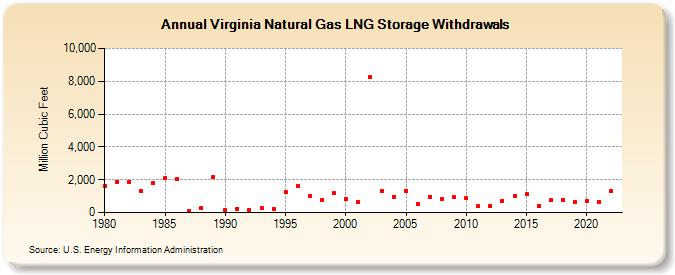
| Virginia Natural Gas LNG Storage Withdrawals (Million Cubic Feet) | |||||
| Decade | Year-0 | Year-1 | Year-2 | Year-3 | Year-4 | Year-5 | Year-6 | Year-7 | Year-8 | Year-9 |
|---|---|---|---|---|---|---|---|---|---|---|
| 1980's | 1,633 | 1,881 | 1,879 | 1,310 | 1,771 | 2,120 | 2,038 | 108 | 260 | 2,173 |
| 1990's | 142 | 243 | 168 | 274 | 236 | 1,276 | 1,614 | 988 | 774 | 1,192 |
| 2000's | 826 | 634 | 8,235 | 1,292 | 973 | 1,342 | 511 | 978 | 811 | 927 |
| 2010's | 871 | 389 | 402 | 724 | 1,005 | 1,115 | 411 | 738 | 784 | 616 |
| 2020's | 675 | 646 | 1,312 |
| - = No Data Reported; -- = Not Applicable; NA = Not Available; W = Withheld to avoid disclosure of individual company data. |
| Release Date: 8/30/2024 |
| Next Release Date: 9/30/2024 |