|
Download Data (XLS File) |
|
|||||
|
|||||
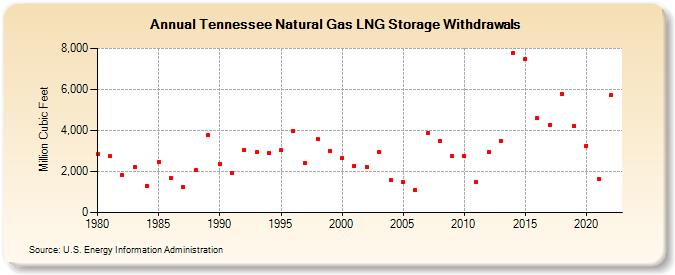
| Tennessee Natural Gas LNG Storage Withdrawals (Million Cubic Feet) | |||||
| Decade | Year-0 | Year-1 | Year-2 | Year-3 | Year-4 | Year-5 | Year-6 | Year-7 | Year-8 | Year-9 |
|---|---|---|---|---|---|---|---|---|---|---|
| 1980's | 2,865 | 2,742 | 1,850 | 2,222 | 1,303 | 2,477 | 1,695 | 1,228 | 2,053 | 3,757 |
| 1990's | 2,377 | 1,923 | 3,065 | 2,931 | 2,879 | 3,035 | 3,985 | 2,416 | 3,562 | 3,005 |
| 2000's | 2,664 | 2,273 | 2,234 | 2,960 | 1,564 | 1,487 | 1,121 | 3,864 | 3,509 | 2,748 |
| 2010's | 2,738 | 1,499 | 2,963 | 3,505 | 7,759 | 7,463 | 4,587 | 4,291 | 5,799 | 4,210 |
| 2020's | 3,258 | 1,643 | 5,710 |
| - = No Data Reported; -- = Not Applicable; NA = Not Available; W = Withheld to avoid disclosure of individual company data. |
| Release Date: 4/30/2024 |
| Next Release Date: 5/31/2024 |