|
Download Data (XLS File) |
|
|||||
|
|||||
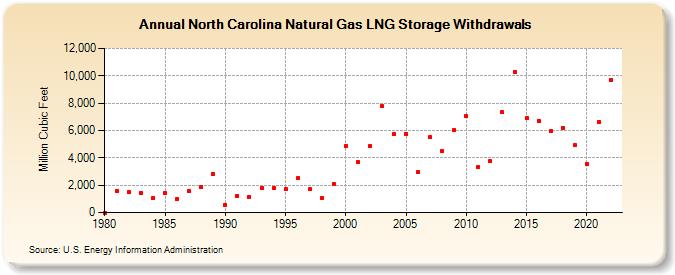
| North Carolina Natural Gas LNG Storage Withdrawals (Million Cubic Feet) | |||||
| Decade | Year-0 | Year-1 | Year-2 | Year-3 | Year-4 | Year-5 | Year-6 | Year-7 | Year-8 | Year-9 |
|---|---|---|---|---|---|---|---|---|---|---|
| 1980's | 0 | 1,591 | 1,483 | 1,427 | 1,063 | 1,397 | 977 | 1,571 | 1,890 | 2,803 |
| 1990's | 578 | 1,232 | 1,122 | 1,823 | 1,802 | 1,710 | 2,490 | 1,686 | 1,083 | 2,089 |
| 2000's | 4,891 | 3,680 | 4,860 | 7,779 | 5,773 | 5,762 | 2,952 | 5,522 | 4,490 | 6,027 |
| 2010's | 7,052 | 3,305 | 3,762 | 7,315 | 10,303 | 6,917 | 6,703 | 5,957 | 6,202 | 4,916 |
| 2020's | 3,537 | 6,621 | 9,678 |
| - = No Data Reported; -- = Not Applicable; NA = Not Available; W = Withheld to avoid disclosure of individual company data. |
| Release Date: 4/30/2024 |
| Next Release Date: 5/31/2024 |