|
Download Data (XLS File) |
|
|||||
|
|||||
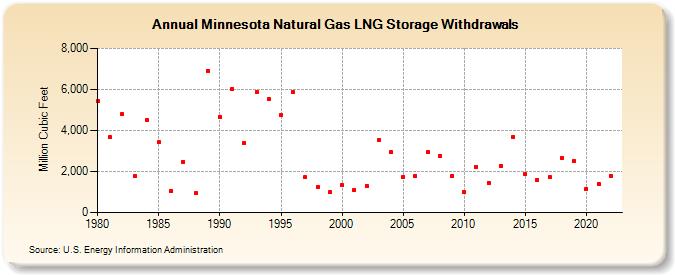
| Minnesota Natural Gas LNG Storage Withdrawals (Million Cubic Feet) | |||||
| Decade | Year-0 | Year-1 | Year-2 | Year-3 | Year-4 | Year-5 | Year-6 | Year-7 | Year-8 | Year-9 |
|---|---|---|---|---|---|---|---|---|---|---|
| 1980's | 5,427 | 3,663 | 4,800 | 1,770 | 4,523 | 3,424 | 1,043 | 2,488 | 949 | 6,916 |
| 1990's | 4,670 | 6,044 | 3,380 | 5,864 | 5,537 | 4,731 | 5,861 | 1,715 | 1,269 | 983 |
| 2000's | 1,340 | 1,103 | 1,302 | 3,555 | 2,933 | 1,743 | 1,793 | 2,941 | 2,780 | 1,798 |
| 2010's | 1,005 | 2,235 | 1,463 | 2,261 | 3,683 | 1,868 | 1,594 | 1,726 | 2,671 | 2,523 |
| 2020's | 1,172 | 1,403 | 1,794 |
| - = No Data Reported; -- = Not Applicable; NA = Not Available; W = Withheld to avoid disclosure of individual company data. |
| Release Date: 3/29/2024 |
| Next Release Date: 4/30/2024 |