|
Download Data (XLS File) |
|
|||||
|
|||||
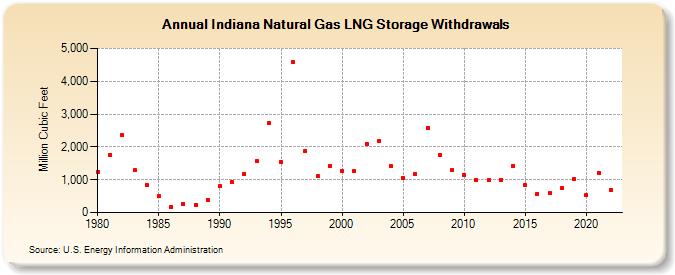
| Indiana Natural Gas LNG Storage Withdrawals (Million Cubic Feet) | |||||
| Decade | Year-0 | Year-1 | Year-2 | Year-3 | Year-4 | Year-5 | Year-6 | Year-7 | Year-8 | Year-9 |
|---|---|---|---|---|---|---|---|---|---|---|
| 1980's | 1,236 | 1,762 | 2,361 | 1,283 | 836 | 494 | 162 | 265 | 244 | 393 |
| 1990's | 796 | 922 | 1,188 | 1,582 | 2,733 | 1,554 | 4,571 | 1,867 | 1,102 | 1,418 |
| 2000's | 1,275 | 1,254 | 2,103 | 2,169 | 1,415 | 1,066 | 1,172 | 2,577 | 1,748 | 1,281 |
| 2010's | 1,148 | 989 | 977 | 1,005 | 1,422 | 830 | 575 | 593 | 748 | 1,017 |
| 2020's | 524 | 1,216 | 701 |
| - = No Data Reported; -- = Not Applicable; NA = Not Available; W = Withheld to avoid disclosure of individual company data. |
| Release Date: 3/29/2024 |
| Next Release Date: 4/30/2024 |