|
Download Data (XLS File) |
|
|||||
|
|||||
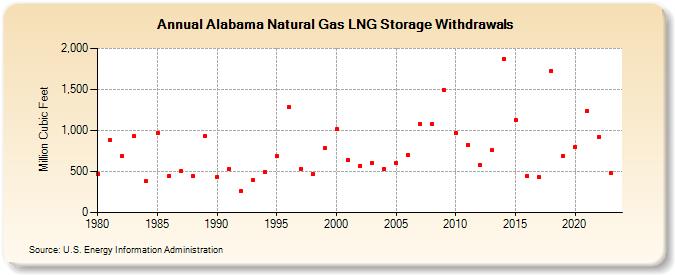
| Alabama Natural Gas LNG Storage Withdrawals (Million Cubic Feet) | |||||
| Decade | Year-0 | Year-1 | Year-2 | Year-3 | Year-4 | Year-5 | Year-6 | Year-7 | Year-8 | Year-9 |
|---|---|---|---|---|---|---|---|---|---|---|
| 1980's | 470 | 878 | 688 | 933 | 379 | 971 | 449 | 511 | 444 | 934 |
| 1990's | 437 | 530 | 262 | 396 | 497 | 688 | 1,282 | 535 | 469 | 783 |
| 2000's | 1,014 | 641 | 573 | 607 | 528 | 606 | 698 | 1,078 | 1,076 | 1,498 |
| 2010's | 968 | 829 | 583 | 759 | 1,869 | 1,130 | 446 | 432 | 1,730 | 686 |
| 2020's | 801 | 1,243 | 926 |
| - = No Data Reported; -- = Not Applicable; NA = Not Available; W = Withheld to avoid disclosure of individual company data. |
| Release Date: 8/30/2024 |
| Next Release Date: 9/30/2024 |