|
Download Data (XLS File) |
|
|||||
|
|||||
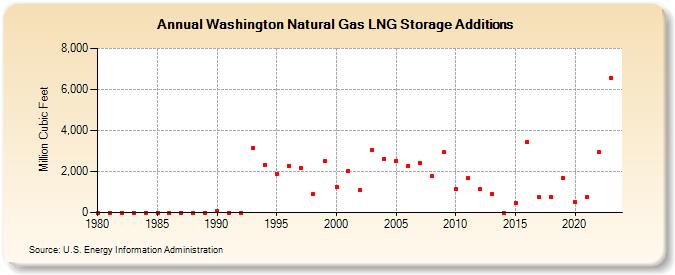
| Washington Natural Gas LNG Storage Additions (Million Cubic Feet) | |||||
| Decade | Year-0 | Year-1 | Year-2 | Year-3 | Year-4 | Year-5 | Year-6 | Year-7 | Year-8 | Year-9 |
|---|---|---|---|---|---|---|---|---|---|---|
| 1980's | 0 | 0 | 0 | 0 | 0 | 0 | 0 | 0 | 0 | 0 |
| 1990's | 96 | 2 | 0 | 3,167 | 2,340 | 1,902 | 2,284 | 2,193 | 902 | 2,502 |
| 2000's | 1,268 | 2,039 | 1,094 | 3,067 | 2,628 | 2,526 | 2,283 | 2,406 | 1,760 | 2,937 |
| 2010's | 1,157 | 1,664 | 1,154 | 905 | 1 | 467 | 3,446 | 738 | 758 | 1,690 |
| 2020's | 520 | 746 | 2,930 |
| - = No Data Reported; -- = Not Applicable; NA = Not Available; W = Withheld to avoid disclosure of individual company data. |
| Release Date: 4/30/2024 |
| Next Release Date: 5/31/2024 |