|
Download Data (XLS File) |
|
|||||
|
|||||
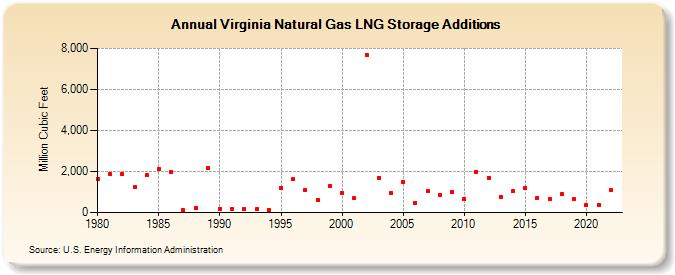
| Virginia Natural Gas LNG Storage Additions (Million Cubic Feet) | |||||
| Decade | Year-0 | Year-1 | Year-2 | Year-3 | Year-4 | Year-5 | Year-6 | Year-7 | Year-8 | Year-9 |
|---|---|---|---|---|---|---|---|---|---|---|
| 1980's | 1,626 | 1,876 | 1,865 | 1,223 | 1,812 | 2,117 | 1,989 | 112 | 231 | 2,167 |
| 1990's | 190 | 173 | 173 | 173 | 116 | 1,214 | 1,631 | 1,096 | 632 | 1,318 |
| 2000's | 972 | 691 | 7,692 | 1,691 | 973 | 1,510 | 487 | 1,057 | 869 | 1,008 |
| 2010's | 664 | 1,977 | 1,699 | 764 | 1,033 | 1,217 | 710 | 663 | 906 | 656 |
| 2020's | 378 | 387 | 1,086 |
| - = No Data Reported; -- = Not Applicable; NA = Not Available; W = Withheld to avoid disclosure of individual company data. |
| Release Date: 3/29/2024 |
| Next Release Date: 4/30/2024 |