|
Download Data (XLS File) |
|
|||||
|
|||||
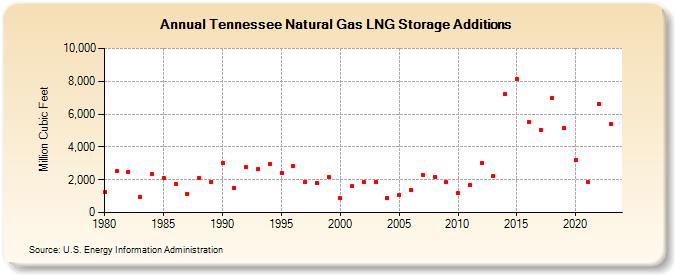
| Tennessee Natural Gas LNG Storage Additions (Million Cubic Feet) | |||||
| Decade | Year-0 | Year-1 | Year-2 | Year-3 | Year-4 | Year-5 | Year-6 | Year-7 | Year-8 | Year-9 |
|---|---|---|---|---|---|---|---|---|---|---|
| 1980's | 1,222 | 2,508 | 2,491 | 977 | 2,376 | 2,105 | 1,766 | 1,135 | 2,109 | 1,879 |
| 1990's | 3,008 | 1,522 | 2,759 | 2,663 | 2,985 | 2,414 | 2,809 | 1,875 | 1,816 | 2,181 |
| 2000's | 884 | 1,606 | 1,849 | 1,889 | 913 | 1,065 | 1,391 | 2,312 | 2,186 | 1,867 |
| 2010's | 1,175 | 1,688 | 3,028 | 2,243 | 7,227 | 8,112 | 5,542 | 5,058 | 7,007 | 5,153 |
| 2020's | 3,207 | 1,853 | 6,623 |
| - = No Data Reported; -- = Not Applicable; NA = Not Available; W = Withheld to avoid disclosure of individual company data. |
| Release Date: 4/30/2024 |
| Next Release Date: 5/31/2024 |