|
Download Data (XLS File) |
|
|||||
|
|||||
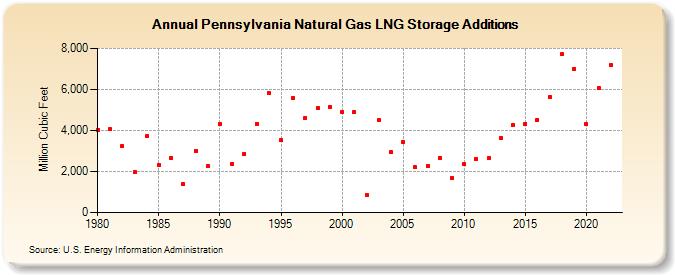
| Pennsylvania Natural Gas LNG Storage Additions (Million Cubic Feet) | |||||
| Decade | Year-0 | Year-1 | Year-2 | Year-3 | Year-4 | Year-5 | Year-6 | Year-7 | Year-8 | Year-9 |
|---|---|---|---|---|---|---|---|---|---|---|
| 1980's | 4,046 | 4,051 | 3,234 | 1,970 | 3,714 | 2,309 | 2,657 | 1,381 | 3,023 | 2,268 |
| 1990's | 4,311 | 2,390 | 2,869 | 4,329 | 5,826 | 3,523 | 5,590 | 4,615 | 5,092 | 5,146 |
| 2000's | 4,918 | 4,907 | 862 | 4,496 | 2,938 | 3,416 | 2,200 | 2,292 | 2,683 | 1,681 |
| 2010's | 2,353 | 2,620 | 2,651 | 3,644 | 4,260 | 4,333 | 4,526 | 5,652 | 7,711 | 6,999 |
| 2020's | 4,312 | 6,067 | 7,183 |
| - = No Data Reported; -- = Not Applicable; NA = Not Available; W = Withheld to avoid disclosure of individual company data. |
| Release Date: 3/29/2024 |
| Next Release Date: 4/30/2024 |