|
Download Data (XLS File) |
|
|||||
|
|||||
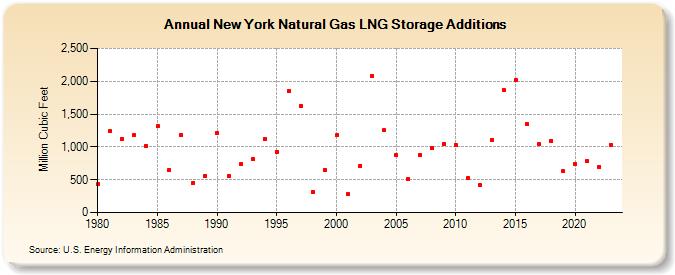
| New York Natural Gas LNG Storage Additions (Million Cubic Feet) | |||||
| Decade | Year-0 | Year-1 | Year-2 | Year-3 | Year-4 | Year-5 | Year-6 | Year-7 | Year-8 | Year-9 |
|---|---|---|---|---|---|---|---|---|---|---|
| 1980's | 432 | 1,240 | 1,124 | 1,174 | 1,017 | 1,312 | 647 | 1,188 | 449 | 564 |
| 1990's | 1,205 | 559 | 732 | 810 | 1,125 | 926 | 1,853 | 1,625 | 318 | 651 |
| 2000's | 1,176 | 276 | 713 | 2,073 | 1,253 | 869 | 510 | 880 | 981 | 1,047 |
| 2010's | 1,032 | 524 | 416 | 1,106 | 1,868 | 2,016 | 1,341 | 1,040 | 1,093 | 629 |
| 2020's | 737 | 782 | 700 |
| - = No Data Reported; -- = Not Applicable; NA = Not Available; W = Withheld to avoid disclosure of individual company data. |
| Release Date: 4/30/2024 |
| Next Release Date: 5/31/2024 |