|
Download Data (XLS File) |
|
|||||
|
|||||
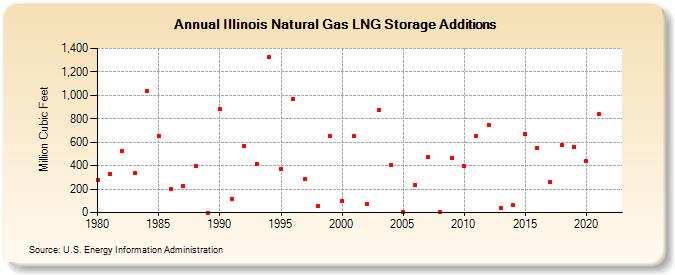
| Illinois Natural Gas LNG Storage Additions (Million Cubic Feet) | |||||
| Decade | Year-0 | Year-1 | Year-2 | Year-3 | Year-4 | Year-5 | Year-6 | Year-7 | Year-8 | Year-9 |
|---|---|---|---|---|---|---|---|---|---|---|
| 1980's | 277 | 327 | 524 | 338 | 1,034 | 653 | 199 | 223 | 393 | 0 |
| 1990's | 883 | 115 | 570 | 417 | 1,326 | 370 | 971 | 283 | 60 | 650 |
| 2000's | 97 | 654 | 69 | 875 | 406 | 3 | 238 | 475 | 1 | 465 |
| 2010's | 398 | 657 | 750 | 40 | 61 | 667 | 549 | 260 | 580 | 560 |
| 2020's | 437 | 837 |
| - = No Data Reported; -- = Not Applicable; NA = Not Available; W = Withheld to avoid disclosure of individual company data. |
| Release Date: 4/30/2024 |
| Next Release Date: 5/31/2024 |