|
Download Data (XLS File) |
|
|||||
|
|||||
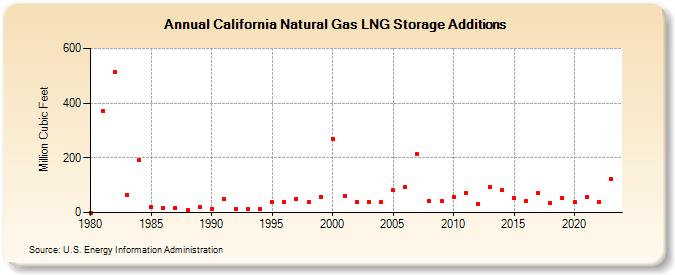
| California Natural Gas LNG Storage Additions (Million Cubic Feet) | |||||
| Decade | Year-0 | Year-1 | Year-2 | Year-3 | Year-4 | Year-5 | Year-6 | Year-7 | Year-8 | Year-9 |
|---|---|---|---|---|---|---|---|---|---|---|
| 1980's | 0 | 371 | 514 | 66 | 191 | 20 | 18 | 18 | 9 | 19 |
| 1990's | 14 | 50 | 13 | 13 | 13 | 39 | 37 | 51 | 37 | 58 |
| 2000's | 270 | 60 | 40 | 39 | 37 | 82 | 92 | 213 | 41 | 41 |
| 2010's | 56 | 73 | 31 | 95 | 83 | 54 | 41 | 71 | 35 | 54 |
| 2020's | 39 | 57 | 39 |
| - = No Data Reported; -- = Not Applicable; NA = Not Available; W = Withheld to avoid disclosure of individual company data. |
| Release Date: 3/29/2024 |
| Next Release Date: 4/30/2024 |