|
Download Data (XLS File) |
|
|||||
|
|||||
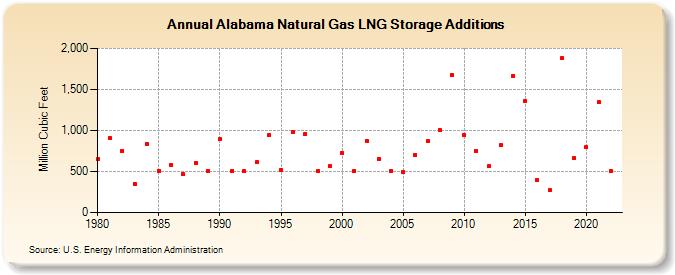
| Alabama Natural Gas LNG Storage Additions (Million Cubic Feet) | |||||
| Decade | Year-0 | Year-1 | Year-2 | Year-3 | Year-4 | Year-5 | Year-6 | Year-7 | Year-8 | Year-9 |
|---|---|---|---|---|---|---|---|---|---|---|
| 1980's | 655 | 908 | 754 | 353 | 838 | 512 | 581 | 465 | 607 | 512 |
| 1990's | 893 | 511 | 501 | 612 | 944 | 524 | 979 | 960 | 501 | 564 |
| 2000's | 729 | 504 | 871 | 655 | 509 | 493 | 704 | 868 | 1,003 | 1,676 |
| 2010's | 946 | 754 | 562 | 822 | 1,664 | 1,356 | 395 | 270 | 1,879 | 664 |
| 2020's | 794 | 1,342 | 511 |
| - = No Data Reported; -- = Not Applicable; NA = Not Available; W = Withheld to avoid disclosure of individual company data. |
| Release Date: 3/29/2024 |
| Next Release Date: 4/30/2024 |