|
Download Data (XLS File) |
|
|||||
|
|||||
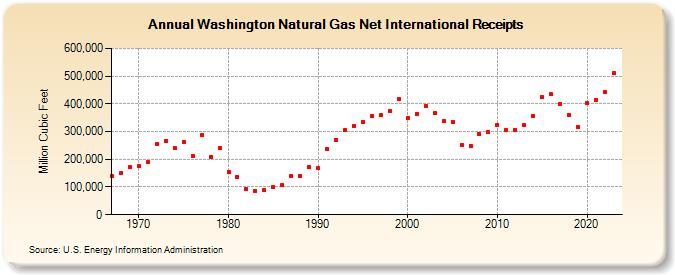
| Washington Natural Gas Net International Receipts (Million Cubic Feet) | |||||
| Decade | Year-0 | Year-1 | Year-2 | Year-3 | Year-4 | Year-5 | Year-6 | Year-7 | Year-8 | Year-9 |
|---|---|---|---|---|---|---|---|---|---|---|
| 1960's | 140,428 | 148,843 | 171,938 | |||||||
| 1970's | 174,098 | 189,134 | 255,496 | 267,401 | 238,905 | 262,443 | 213,243 | 286,437 | 209,577 | 239,368 |
| 1980's | 154,488 | 134,322 | 92,027 | 86,576 | 90,001 | 99,180 | 107,151 | 139,021 | 140,826 | 170,832 |
| 1990's | 168,441 | 235,614 | 270,477 | 306,030 | 320,362 | 335,261 | 355,260 | 360,261 | 374,458 | 415,636 |
| 2000's | 347,992 | 364,521 | 393,452 | 366,224 | 337,508 | 335,380 | 253,214 | 247,526 | 289,850 | 296,986 |
| 2010's | 324,589 | 304,154 | 306,220 | 322,642 | 355,801 | 424,320 | 434,076 | 399,288 | 359,163 | 317,038 |
| 2020's | 401,237 | 415,151 | 441,967 |
| - = No Data Reported; -- = Not Applicable; NA = Not Available; W = Withheld to avoid disclosure of individual company data. |
| Release Date: 4/30/2024 |
| Next Release Date: 5/31/2024 |