|
Download Data (XLS File) |
|
|||||
|
|||||
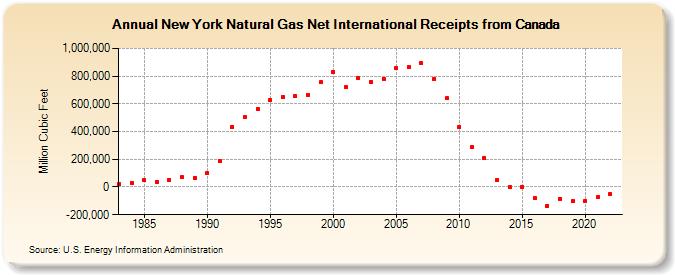
| New York Natural Gas Net International Receipts from Canada (Million Cubic Feet) | |||||
| Decade | Year-0 | Year-1 | Year-2 | Year-3 | Year-4 | Year-5 | Year-6 | Year-7 | Year-8 | Year-9 |
|---|---|---|---|---|---|---|---|---|---|---|
| 1980's | 22,348 | 29,326 | 47,677 | 35,720 | 52,013 | 69,193 | 67,956 | |||
| 1990's | 98,217 | 188,233 | 435,470 | 502,701 | 562,267 | 630,321 | 652,578 | 656,332 | 666,256 | 754,484 |
| 2000's | 832,762 | 718,387 | 787,579 | 759,644 | 782,372 | 856,107 | 865,952 | 892,281 | 780,862 | 640,119 |
| 2010's | 434,526 | 285,692 | 209,580 | 49,382 | -1,298 | 1,560 | -80,469 | -137,111 | -83,862 | -100,830 |
| 2020's | -99,148 | -73,137 | -50,459 |
| - = No Data Reported; -- = Not Applicable; NA = Not Available; W = Withheld to avoid disclosure of individual company data. |
| Release Date: 4/30/2024 |
| Next Release Date: 5/31/2024 |