|
Download Data (XLS File) |
|
|||||
|
|||||
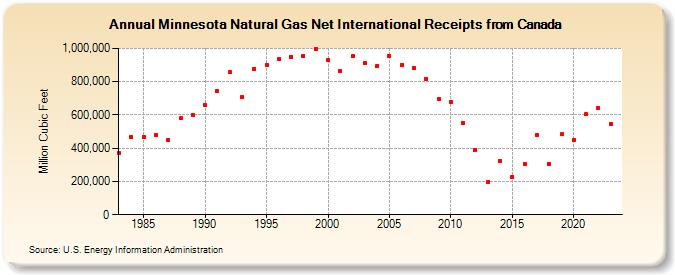
| Minnesota Natural Gas Net International Receipts from Canada (Million Cubic Feet) | |||||
| Decade | Year-0 | Year-1 | Year-2 | Year-3 | Year-4 | Year-5 | Year-6 | Year-7 | Year-8 | Year-9 |
|---|---|---|---|---|---|---|---|---|---|---|
| 1980's | 372,334 | 467,974 | 468,926 | 479,322 | 448,392 | 578,982 | 602,096 | |||
| 1990's | 657,169 | 741,353 | 855,300 | 707,795 | 875,226 | 899,364 | 937,806 | 950,706 | 956,733 | 998,603 |
| 2000's | 928,332 | 862,889 | 951,669 | 914,993 | 892,989 | 956,814 | 902,974 | 879,578 | 817,609 | 697,631 |
| 2010's | 680,515 | 550,763 | 391,221 | 197,680 | 325,481 | 226,040 | 302,967 | 481,211 | 304,063 | 482,858 |
| 2020's | 452,044 | 603,749 | 644,055 |
| - = No Data Reported; -- = Not Applicable; NA = Not Available; W = Withheld to avoid disclosure of individual company data. |
| Release Date: 4/30/2024 |
| Next Release Date: 5/31/2024 |