|
Download Data (XLS File) |
|
|||||
|
|||||
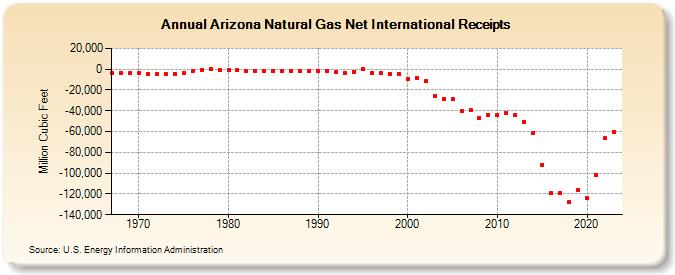
| Arizona Natural Gas Net International Receipts (Million Cubic Feet) | |||||
| Decade | Year-0 | Year-1 | Year-2 | Year-3 | Year-4 | Year-5 | Year-6 | Year-7 | Year-8 | Year-9 |
|---|---|---|---|---|---|---|---|---|---|---|
| 1960's | -3,716 | -3,891 | -3,880 | |||||||
| 1970's | -4,044 | -4,659 | -4,521 | -4,477 | -4,217 | -3,223 | -1,665 | -672 | 0 | -706 |
| 1980's | -686 | -904 | -1,694 | -1,646 | -1,757 | -1,813 | -1,525 | -1,757 | -1,905 | -1,469 |
| 1990's | -1,676 | -1,597 | -2,565 | -3,253 | -2,459 | -42 | -3,405 | -3,901 | -4,166 | -4,279 |
| 2000's | -9,099 | -8,452 | -11,257 | -26,205 | -28,875 | -28,713 | -40,113 | -39,524 | -46,581 | -44,152 |
| 2010's | -43,836 | -42,026 | -43,838 | -50,729 | -60,930 | -92,208 | -119,177 | -118,688 | -128,126 | -116,204 |
| 2020's | -124,264 | -101,652 | -66,601 |
| - = No Data Reported; -- = Not Applicable; NA = Not Available; W = Withheld to avoid disclosure of individual company data. |
| Release Date: 4/30/2024 |
| Next Release Date: 5/31/2024 |