|
Download Data (XLS File) |
|
|||||
|
|||||
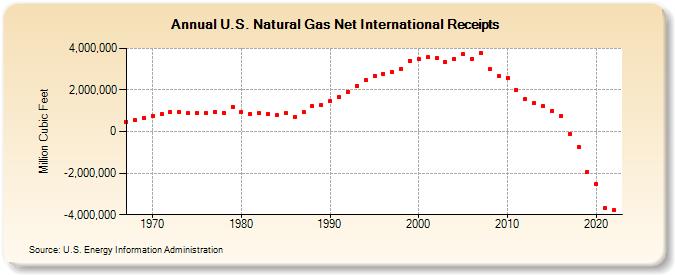
| U.S. Natural Gas Net International Receipts (Million Cubic Feet) | |||||
| Decade | Year-0 | Year-1 | Year-2 | Year-3 | Year-4 | Year-5 | Year-6 | Year-7 | Year-8 | Year-9 |
|---|---|---|---|---|---|---|---|---|---|---|
| 1960's | 482,612 | 558,140 | 675,647 | |||||||
| 1970's | 750,967 | 854,336 | 941,483 | 955,732 | 882,495 | 880,333 | 899,057 | 955,376 | 913,013 | 1,197,710 |
| 1980's | 936,036 | 844,769 | 881,441 | 864,600 | 788,216 | 894,087 | 690,478 | 938,148 | 1,219,590 | 1,274,651 |
| 1990's | 1,447,407 | 1,644,341 | 1,921,225 | 2,209,931 | 2,477,361 | 2,686,929 | 2,784,020 | 2,868,547 | 3,015,170 | 3,411,302 |
| 2000's | 3,467,210 | 3,567,946 | 3,557,469 | 3,345,940 | 3,495,034 | 3,710,404 | 3,489,919 | 3,778,879 | 2,989,770 | 2,664,874 |
| 2010's | 2,595,084 | 1,999,552 | 1,575,676 | 1,364,469 | 1,207,946 | 991,146 | 740,693 | -107,044 | -730,717 | -1,923,867 |
| 2020's | -2,526,209 | -3,660,057 | -3,789,101 |
| - = No Data Reported; -- = Not Applicable; NA = Not Available; W = Withheld to avoid disclosure of individual company data. |
| Release Date: 4/30/2024 |
| Next Release Date: 5/31/2024 |
Referring Pages: