|
Download Data (XLS File) |
|
||||||||
|
||||||||
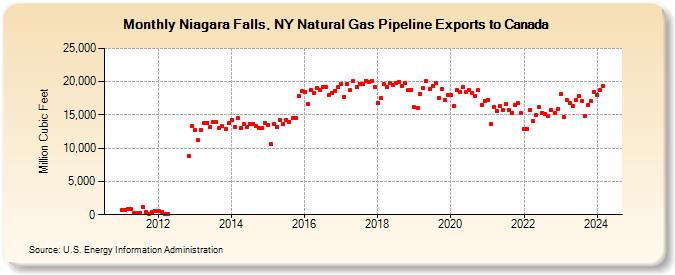
| Niagara Falls, NY Natural Gas Pipeline Exports to Canada (Million Cubic Feet) | ||||||||
| Year | Jan | Feb | Mar | Apr | May | Jun | Jul | Aug | Sep | Oct | Nov | Dec |
|---|---|---|---|---|---|---|---|---|---|---|---|---|
| 2011 | 734 | 660 | 860 | 860 | 194 | 307 | 295 | 1,107 | 376 | 151 | 415 | 576 |
| 2012 | 583 | 468 | 175 | 58 | 8,823 | 13,281 | ||||||
| 2013 | 12,716 | 11,162 | 12,737 | 13,738 | 13,789 | 13,174 | 13,904 | 13,939 | 13,022 | 13,267 | 12,940 | 13,715 |
| 2014 | 14,211 | 13,161 | 14,549 | 13,012 | 13,641 | 13,234 | 13,634 | 13,645 | 13,274 | 13,071 | 13,092 | 13,797 |
| 2015 | 13,470 | 10,576 | 13,577 | 13,247 | 14,219 | 13,657 | 14,297 | 14,009 | 14,476 | 14,578 | 17,873 | 18,617 |
| 2016 | 18,408 | 16,645 | 18,791 | 18,312 | 19,004 | 18,807 | 19,225 | 19,153 | 17,925 | 18,294 | 18,584 | 19,123 |
| 2017 | 19,721 | 17,758 | 19,591 | 18,707 | 20,029 | 19,179 | 19,673 | 19,653 | 20,167 | 19,972 | 20,050 | 19,132 |
| 2018 | 16,853 | 17,509 | 19,576 | 19,245 | 19,745 | 19,428 | 19,838 | 19,994 | 19,319 | 19,773 | 18,781 | 18,766 |
| 2019 | 16,141 | 16,041 | 18,199 | 18,997 | 20,025 | 18,897 | 19,303 | 19,753 | 17,551 | 18,876 | 17,295 | 17,933 |
| 2020 | 17,989 | 16,399 | 18,784 | 18,513 | 19,186 | 18,486 | 18,745 | 18,327 | 17,824 | 18,722 | 16,531 | 17,102 |
| 2021 | 17,234 | 13,668 | 16,243 | 15,612 | 16,273 | 15,688 | 16,641 | 15,794 | 15,336 | 16,488 | 16,746 | 15,226 |
| 2022 | 12,880 | 12,903 | 15,749 | 14,046 | 14,921 | 16,175 | 15,278 | 15,106 | 14,892 | 15,684 | 16,463 | 17,136 |
| 2023 | 18,120 | 14,680 | 17,304 | 16,840 | 16,328 | 17,314 | 17,898 | 17,033 | 14,852 | 16,531 | 17,127 | 18,417 |
| 2024 | 17,997 | 18,673 | 19,288 | 15,824 | 15,864 | 16,783 | ||||||
| - = No Data Reported; -- = Not Applicable; NA = Not Available; W = Withheld to avoid disclosure of individual company data. |
| Release Date: 8/30/2024 |
| Next Release Date: 9/30/2024 |