|
Download Data (XLS File) |
|
||||||||
|
||||||||
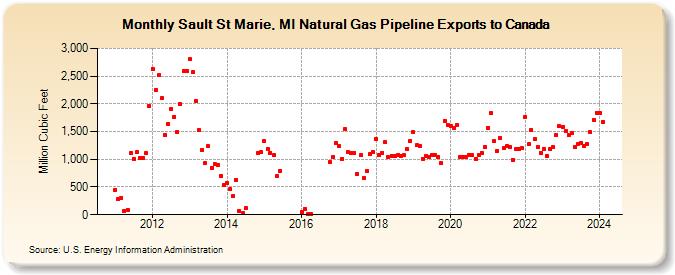
| Sault St Marie, MI Natural Gas Pipeline Exports to Canada (Million Cubic Feet) | ||||||||
| Year | Jan | Feb | Mar | Apr | May | Jun | Jul | Aug | Sep | Oct | Nov | Dec |
|---|---|---|---|---|---|---|---|---|---|---|---|---|
| 2011 | 453 | 278 | 308 | 68 | 87 | 1,115 | 1,010 | 1,125 | 1,019 | 1,026 | 1,107 | 1,960 |
| 2012 | 2,630 | 2,246 | 2,518 | 2,102 | 1,445 | 1,633 | 1,910 | 1,763 | 1,489 | 1,996 | 2,591 | 2,590 |
| 2013 | 2,802 | 2,569 | 2,054 | 1,531 | 1,171 | 935 | 1,231 | 849 | 911 | 896 | 705 | 542 |
| 2014 | 572 | 461 | 333 | 632 | 74 | 23 | 119 | 1,114 | 1,131 | |||
| 2015 | 1,322 | 1,189 | 1,120 | 1,074 | 690 | 793 | ||||||
| 2016 | 48 | 112 | 8 | 8 | 948 | 1,036 | 1,288 | |||||
| 2017 | 1,234 | 1,010 | 1,545 | 1,123 | 1,114 | 1,117 | 740 | 1,072 | 661 | 796 | 1,090 | 1,130 |
| 2018 | 1,368 | 1,074 | 1,122 | 1,307 | 1,036 | 1,067 | 1,060 | 1,074 | 1,052 | 1,071 | 1,181 | 1,337 |
| 2019 | 1,485 | 1,251 | 1,235 | 1,013 | 1,057 | 1,039 | 1,082 | 1,071 | 1,037 | 924 | 1,699 | 1,625 |
| 2020 | 1,600 | 1,567 | 1,612 | 1,038 | 1,050 | 1,041 | 1,075 | 1,071 | 1,013 | 1,077 | 1,115 | 1,223 |
| 2021 | 1,570 | 1,830 | 1,322 | 1,156 | 1,380 | 1,201 | 1,234 | 1,227 | 988 | 1,177 | 1,179 | 1,195 |
| 2022 | 1,766 | 1,273 | 1,534 | 1,367 | 1,222 | 1,120 | 1,193 | 1,063 | 1,177 | 1,215 | 1,439 | 1,598 |
| 2023 | 1,591 | 1,502 | 1,434 | 1,475 | 1,228 | 1,281 | 1,299 | 1,248 | 1,267 | 1,490 | 1,717 | 1,841 |
| 2024 | 1,828 | |||||||||||
| - = No Data Reported; -- = Not Applicable; NA = Not Available; W = Withheld to avoid disclosure of individual company data. |
| Release Date: 3/29/2024 |
| Next Release Date: 4/30/2024 |