|
Download Data (XLS File) |
|
||||||||
|
||||||||
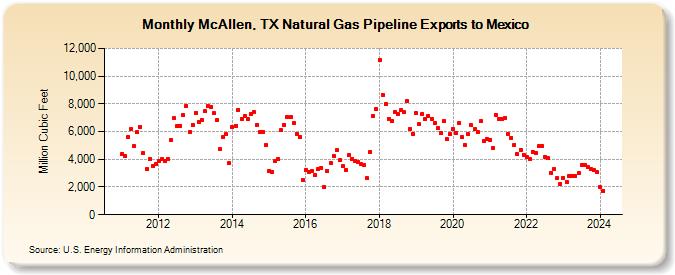
| McAllen, TX Natural Gas Pipeline Exports to Mexico (Million Cubic Feet) | ||||||||
| Year | Jan | Feb | Mar | Apr | May | Jun | Jul | Aug | Sep | Oct | Nov | Dec |
|---|---|---|---|---|---|---|---|---|---|---|---|---|
| 2011 | 4,414 | 4,236 | 5,595 | 6,174 | 4,938 | 5,946 | 6,359 | 4,438 | 3,287 | 4,027 | 3,516 | 3,639 |
| 2012 | 3,880 | 3,990 | 3,846 | 4,037 | 5,402 | 6,945 | 6,385 | 6,426 | 7,166 | 7,864 | 5,984 | 6,499 |
| 2013 | 7,367 | 6,711 | 6,846 | 7,455 | 7,844 | 7,804 | 7,319 | 6,841 | 4,714 | 5,574 | 5,794 | 3,729 |
| 2014 | 6,302 | 6,427 | 7,591 | 6,906 | 7,105 | 6,933 | 7,273 | 7,427 | 6,502 | 5,952 | 5,952 | 5,026 |
| 2015 | 3,182 | 3,091 | 3,873 | 4,008 | 6,087 | 6,492 | 7,051 | 7,047 | 6,620 | 5,844 | 5,637 | 2,470 |
| 2016 | 3,255 | 3,073 | 3,143 | 2,850 | 3,311 | 3,398 | 1,988 | 3,154 | 3,767 | 4,235 | 4,668 | 3,916 |
| 2017 | 3,481 | 3,223 | 4,300 | 4,030 | 3,899 | 3,819 | 3,646 | 3,600 | 2,626 | 4,553 | 7,136 | 7,632 |
| 2018 | 11,153 | 8,663 | 7,979 | 6,939 | 6,761 | 7,433 | 7,240 | 7,531 | 7,385 | 8,178 | 6,202 | 5,820 |
| 2019 | 7,337 | 6,543 | 7,279 | 6,916 | 7,133 | 6,938 | 6,603 | 6,251 | 5,896 | 6,753 | 5,441 | 5,822 |
| 2020 | 6,196 | 5,863 | 6,619 | 5,601 | 5,027 | 5,793 | 6,452 | 6,195 | 5,958 | 6,752 | 5,291 | 5,471 |
| 2021 | 5,416 | 4,825 | 7,219 | 6,872 | 6,927 | 7,004 | 5,859 | 5,555 | 5,060 | 4,354 | 4,681 | 4,323 |
| 2022 | 4,158 | 4,030 | 4,546 | 4,453 | 4,933 | 4,966 | 4,195 | 4,058 | 3,041 | 3,300 | 2,617 | 2,244 |
| 2023 | 2,649 | 2,378 | 2,774 | 2,785 | 2,793 | 2,980 | 3,565 | 3,621 | 3,408 | 3,303 | 3,194 | 3,064 |
| 2024 | 1,966 | 1,723 | ||||||||||
| - = No Data Reported; -- = Not Applicable; NA = Not Available; W = Withheld to avoid disclosure of individual company data. |
| Release Date: 4/30/2024 |
| Next Release Date: 5/31/2024 |