|
Download Data (XLS File) |
|
||||||||
|
||||||||
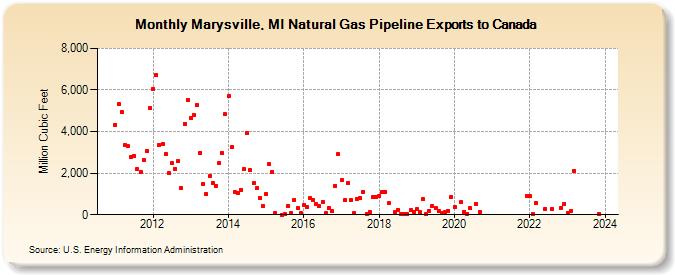
| Marysville, MI Natural Gas Pipeline Exports to Canada (Million Cubic Feet) | ||||||||
| Year | Jan | Feb | Mar | Apr | May | Jun | Jul | Aug | Sep | Oct | Nov | Dec |
|---|---|---|---|---|---|---|---|---|---|---|---|---|
| 2011 | 4,338 | 5,323 | 4,952 | 3,361 | 3,295 | 2,761 | 2,838 | 2,182 | 2,061 | 2,644 | 3,085 | 5,122 |
| 2012 | 6,067 | 6,721 | 3,354 | 3,404 | 2,923 | 1,986 | 2,475 | 2,217 | 2,574 | 1,273 | 4,365 | 5,506 |
| 2013 | 4,648 | 4,807 | 5,273 | 2,983 | 1,470 | 995 | 1,856 | 1,524 | 1,400 | 2,511 | 2,980 | 4,827 |
| 2014 | 5,707 | 3,266 | 1,088 | 1,030 | 1,210 | 2,186 | 3,940 | 2,133 | 1,526 | 1,272 | 798 | 427 |
| 2015 | 998 | 2,425 | 2,055 | 93 | 8 | 11 | 411 | 96 | 722 | 315 | 77 | |
| 2016 | 450 | 368 | 782 | 699 | 512 | 406 | 634 | 68 | 317 | 155 | 1,402 | 2,901 |
| 2017 | 1,655 | 692 | 1,515 | 715 | 75 | 763 | 793 | 1,105 | 41 | 122 | 850 | 836 |
| 2018 | 923 | 1,092 | 1,096 | 547 | 109 | 235 | 20 | 23 | 35 | 207 | 152 | |
| 2019 | 252 | 112 | 733 | 30 | 192 | 439 | 318 | 168 | 63 | 112 | 183 | 851 |
| 2020 | 391 | 595 | 150 | 45 | 304 | 496 | 148 | |||||
| 2021 | 912 | |||||||||||
| 2022 | 885 | 23 | 560 | 276 | 286 | 338 | 532 | |||||
| 2023 | 94 | 193 | 2,115 | 53 | ||||||||
| - = No Data Reported; -- = Not Applicable; NA = Not Available; W = Withheld to avoid disclosure of individual company data. |
| Release Date: 3/29/2024 |
| Next Release Date: 4/30/2024 |