|
Download Data (XLS File) |
|
||||||||
|
||||||||
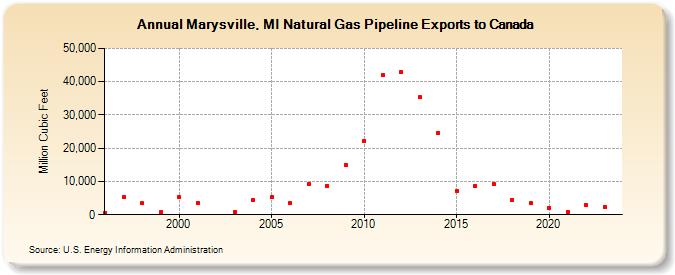
| Marysville, MI Natural Gas Pipeline Exports to Canada (Million Cubic Feet) | ||||||||
| Decade | Year-0 | Year-1 | Year-2 | Year-3 | Year-4 | Year-5 | Year-6 | Year-7 | Year-8 | Year-9 |
|---|---|---|---|---|---|---|---|---|---|---|
| 1990's | 638 | 5,286 | 3,377 | 691 | ||||||
| 2000's | 5,320 | 3,651 | NA | 811 | 4,455 | 5,222 | 3,483 | 9,158 | 8,756 | 14,925 |
| 2010's | 22,198 | 41,964 | 42,866 | 35,273 | 24,583 | 7,208 | 8,695 | 9,160 | 4,437 | 3,453 |
| 2020's | 2,130 | 912 | 2,901 | 2,455 |
| - = No Data Reported; -- = Not Applicable; NA = Not Available; W = Withheld to avoid disclosure of individual company data. |
| Release Date: 3/29/2024 |
| Next Release Date: 4/30/2024 |