|
Download Data (XLS File) |
|
||||||||
|
||||||||
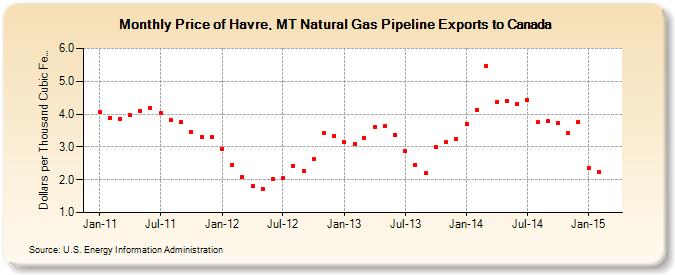
| Price of Havre, MT Natural Gas Pipeline Exports to Canada (Dollars per Thousand Cubic Feet) | ||||||||
| Year | Jan | Feb | Mar | Apr | May | Jun | Jul | Aug | Sep | Oct | Nov | Dec |
|---|---|---|---|---|---|---|---|---|---|---|---|---|
| 2011 | 4.06 | 3.88 | 3.86 | 3.97 | 4.09 | 4.18 | 4.03 | 3.83 | 3.76 | 3.44 | 3.31 | 3.30 |
| 2012 | 2.95 | 2.46 | 2.08 | 1.82 | 1.73 | 2.02 | 2.05 | 2.43 | 2.27 | 2.62 | 3.43 | 3.34 |
| 2013 | 3.16 | 3.08 | 3.27 | 3.61 | 3.64 | 3.36 | 2.86 | 2.45 | 2.19 | 3.00 | 3.14 | 3.25 |
| 2014 | 3.71 | 4.12 | 5.47 | 4.36 | 4.41 | 4.30 | 4.42 | 3.75 | 3.78 | 3.73 | 3.42 | 3.75 |
| 2015 | 2.37 | 2.23 | ||||||||||
| - = No Data Reported; -- = Not Applicable; NA = Not Available; W = Withheld to avoid disclosure of individual company data. |
| Release Date: 4/30/2024 |
| Next Release Date: 5/31/2024 |